Guide
How to read a YieldPulse report
A report opens with its answer and then shows the working, a section to a question. This is how to read each.
Reviewed
Each term is defined in the glossary. All guides.
What a report is
A report takes one property and sets what is asked for it against what was registered: what homes like it sold for, what they let for, and what the building costs to hold. It works the sums twice, once on the figures you entered and once on the register’s, and it opens with an answer.
It is not a valuation, a forecast or advice. It does not replace a lawyer, a bank’s valuer or a survey of the property.
- Should you buy it? The answer, each reason, and what would change it.
- Is the price right? The asking price beside registered sales.
- Is the rent realistic? The rent you expect beside registered tenancies.
- What does the building really cost to hold? The service charge on file, and the yield at that charge.
- What does it cost to buy? Every fee, with its source.
- What does the loan do to it? The deposit, the payment, and what is left as rates move.
- What if it goes wrong? The same sums on worse terms.
- What do you walk away with? A sale in each year to ten.
- How this was worked out. Every assumption, source and date.
A home bought off plan has one more section, on when the money is due. The sample report shows every section. A report is priced per report, with no subscription, and the pricing page has today’s price.
The registered evidence is Dubai’s, because Dubai publishes its register as open data. For a property in another emirate the sections on price, rent and the building become one, which says what could not be checked, and the answer can then be no better than a conditional one.
Should you buy it?
The report opens with its answer: yes, no, or only on a condition. Under it are the reasons, each marked as a pass, a caution or a fail and each naming the section that works it out. Then it says what would change the answer: the price, the rent or the deposit at which a fail would become a pass.
The rules are fixed, and the last section states them. A report says no when the asking price sits above nearly all registered sales, when the net yield is below the Central Bank’s base rate (3.90% since 17 September 2026), or when a year’s rent after costs does not cover the year’s mortgage interest. A deposit below the Central Bank’s minimum for the buyer (50% off plan, for one) could not buy the loan, so the figures are worked on the minimum and the report says so.
Two sets of figures run through every section. As you entered is your own. On the register is the same sum with the registered median rent and the building’s registered service charge. The headline figures are always your own, and the answer weighs both.
The answer reads the numbers of one property. It does not know your income, your other property or your plans, so it is not personal advice.
We take no commission and work for no agent, and a report costs the same whatever it says. The answer can be no.
Is the price right?
This section sets the asking price beside registered sales of homes like it, at each level that has enough of them: the building, the project, the community.
Registered sales are a spread. A report gives the median, which half the sales fell below, and the range most of them fell in. Then it marks where the asking price sits.
The sample report’s flat, entered at AED 1,450,000 (AED 1,667 a sq ft), against 16 registered sales of completed one-bedroom flats in Princess Tower, 12 months to 7 October 2026, in AED a sq ft. The bar is the middle half of them, from 1,505 to 1,741, and the tick is the median, 1,554. With fewer than twenty sales the ends of the spread are not quoted. The asking price and the rent expected are an example of ours, entered for the sample report. They are not a listing. The same property, in full.
An asking price above most registered sales is a question to put to the seller. The flat may be on a higher floor, newly fitted or furnished, and the register records none of that.
Look at how many sales the figures rest on and over how many months. Where a building has too few, the report moves up to the next level, names it, and says how many it held back. A figure that fails the reliability rules does not reach a report.
Is the rent realistic?
This section sets the rent you expect beside registered tenancies: contracts registered with Ejari for homes like yours, new lettings and renewals apart.
New contracts say more about today’s rent than renewals do. Dubai limits how far a rent may rise when a tenancy is renewed (Decree No. 43 of 2013), so a tenant who stays can be paying less than a new one would.
Use the rent a tenant would pay today, not the rent a listing hopes for. If yours is above most registered new tenancies, the report tests the income at the registered median as well, and the answer can turn on it.
A registered rent says nothing about the condition of the home or what was let with it.
What does the building really cost to hold?
This section gives the building’s registered service charge for each budget year on file, what it pays for, and how the building sits beside others in its community. It then works the net yield at that charge, beside the figure you entered.
Read the level and the direction. Multiply the rate by your floor area for the yearly cost, then look at how the rate has moved.
Service charges explains what the charge pays for and how to check it.
What does it cost to buy?
This section lists every fee, how it is worked out and where the figure comes from. Each is marked: read on an official page, market practice, or not confirmed. Then it gives the cash to complete for each kind of buyer.
The cash to complete is the figure to have in your account on the day: the deposit and every fee. What it costs to buy works the fees through.
What does the loan do to it?
This section shows the deposit the Central Bank’s rules require of a buyer like you, the monthly payment, and what is left each month at several rates: the base rate, recent EIBOR fixings, your own rate and a lender’s own test. It also gives the rate at which nothing is left.
Cash flow is what is left of the rent after the costs of holding and the mortgage. Net yield is the same with a loan or without one. Cash flow is not. Gross yield, net yield and cash flow works each figure through.
It is not a mortgage offer. A bank decides what it will lend you. How much a bank may lend has the limits.
What if it goes wrong?
This section works the same sums on worse terms. Rent, the time the home stands empty, the mortgage rate, the service charge and the price are each moved singly, and then together. It gives the points at which the purchase stops working, and what a forced sale in year three would leave.
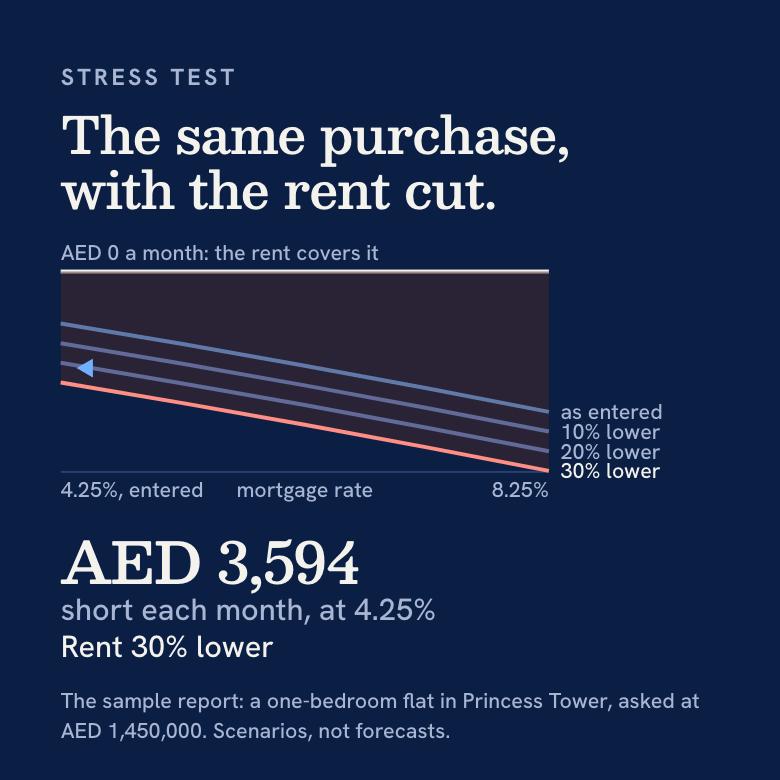
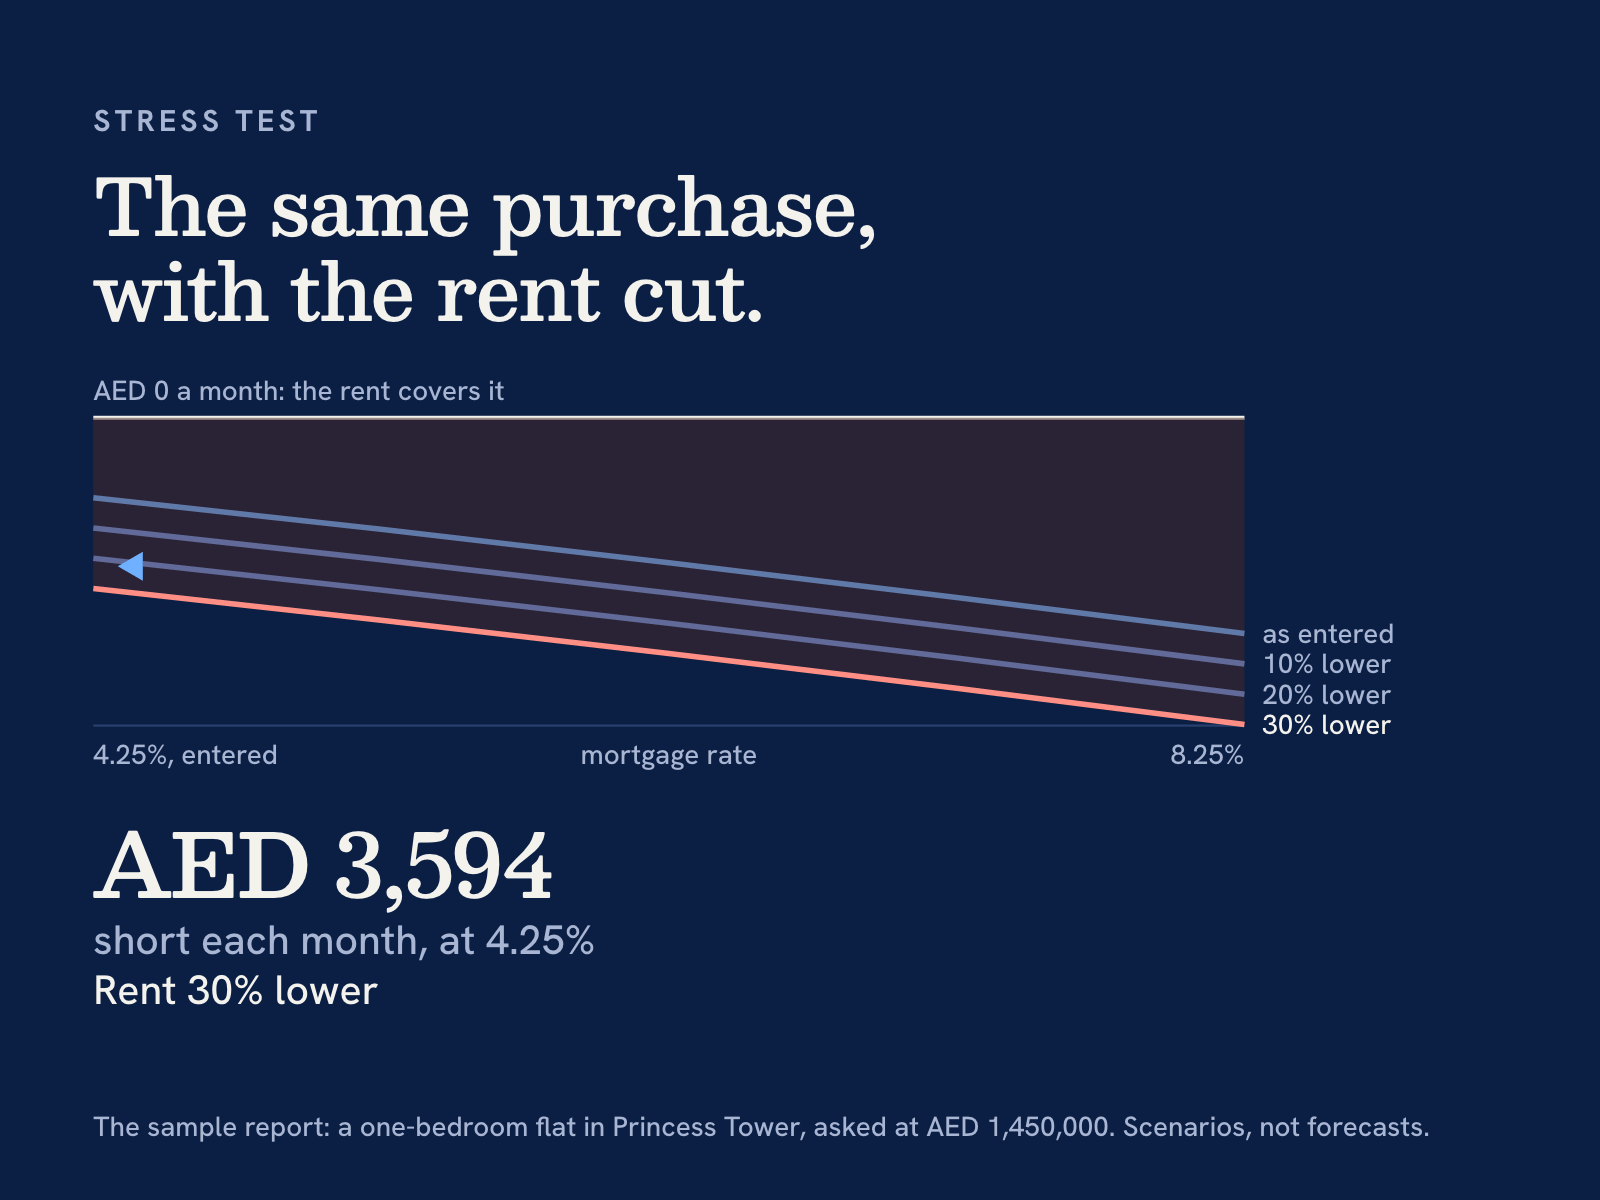
One case of several bad turns at once, worked on the sample report’s flat: rent down 10%, two months empty, rate up one point, prices down 10%.
- Each month, as things standRent after costs, less the mortgage payment.
- AED 1,682 out
- Each month, in that case
- AED 3,730 out
- A sale in year three, in that caseUp or down in all on the AED 408,390 put in.
- AED 367,026 out
A figure in brackets is money out. These are stated tests, not forecasts. The asking price and the rent expected are an example of ours, entered for the sample report. They are not a listing. The same property, in full.
Nobody can tell you whether prices will fall, and we do not forecast. The test shows what you would be up or down if they did.
Read this section for whether you could keep paying. A purchase that only pays its way when nothing goes wrong leaves you no margin.
Off-plan: when is the money due?
This section is in a report only for a home bought off plan. It sets out what is paid before handover and what falls due at handover, each instalment with its date, and the most a loan can fund.
Set the schedule against the cash you will have on each date. It also shows what a late handover does. Off-plan and payment plans explains why the sums differ from a finished flat’s.
What do you walk away with?
This section works a sale. You set three scenarios for prices, and the report shows what you would be up or down in each year to ten, after the loan is repaid and the costs of selling are paid. It gives the year in which you would first get your money back.
The scenarios are yours, not ours. A report does not say which will happen. The return over a hold explains the figure it uses.
How this was worked out
The last section says what the registered figures are and are not, the rules by which a figure is held back, and how the answer is reached. It lists what you entered and what the report assumed, each with its source and date, and the day each dataset was read.
It also says what a formal valuation would add. Read it when a figure surprises you: the reason is usually there.
What to do with it
- Check the cash. The deposit and every buying cost must be in your account on the day, with a reserve left over.
- Check the month. If cash flow is negative, that is a payment from your own income for as long as you hold.
- Read what would change the answer, and ask whether the seller, or you, could meet it.
- Compare. A comparison takes two to four reports, ranks them and gives a reason for each place.
- Go and see the property, read the service charge invoice, and take legal advice before you sign.
Start with the calculator. Its results are free and it asks for no email.